


One of the main reasons people need media is to get information. And of course, information values more (and coasts more) when it’s new and has good quality. So I’m focusing on the news side of media and on visual, digital future of journalism.
I think it’s already obvious that news information to be considered serious and reliable needs to have the photo or better video proof. In the digital era, a lot of words can be posted that isn’t true, so the audience needs evidence. There’re still authority sources of information like AP, BBC, etc. whose text information only already can be considered reliable, but even they’re trying to illustrate as much news as possible. (It easily can be checked by visiting their websites or watching news blocks.) Firstly, there’s a scientific reason for it. Our brains process visuals 60,000x quicker than text (Drefs, M). That means, by visualizing you can give and receive more and faster information. Time and information are highly important in the modern era and the world only increase its speed day by day. So that’s a reason why I think text news information will continue its visualization tendency.
People already consume more news in audio and video format and so they’ll do in the future. We know television is all about audio-visual, and TV still is “the king” on information delivery field (Internet is second) (“The Future of News”). On the other hand, there’re a lot of cases when image or video makes news and leads the story, making discussion, revealing problems in society. Photo or video evidence value more than text one, and news actually can be written on photo or video. And mass media counts on that in the news-making process.
To support the idea of visualizing tendency in mass media another thing can be said. News making process has changed a lot because of the technical revolution. Past generations of journalists needed expensive professional equipment (microphones, cameras, etc.) and many workers to film the news. NBC digital correspondent Mara Schiavocampo says now all she needs to do her job is a good Internet connection (“The Future of News”). With affordable personal cameras and computers, reporters can take pictures and film news easily, and provide new information to the audience faster. They even don’t necessarily need a computer anymore. Everything has changed because of mobile phones. “This is a hand-held computer, camera and video recorder that happens to make phone calls”, - says Walter S. Mossberg (“The Future of News”). He was a columnist in the Wall Street Journal for many years writing articles (basically, only text information) for the journal; then his column was in a TV format. Now he does his job sitting in front of the computer, and in fact, the audience likes this intimate format of delivering information from person to person, not transforming information in text or another sign system (“The Future of News”). So visualization tendency in news information delivery will keep going because audio-visual information feels like more personal.
It’s all about individual tendency also. People want their news information to be more personal, more specific and formed according to their interests. Internet wins TV in this battle. Of course, one can choose channels he wants to watch, but still content on channels is formed in particular order according to the channel’s priorities. The Internet is more flexible and also about audio-visual information. And what’s more important, you can “take the Internet with you”.
Attached file: Forecasting media future.docx
Click download to get access to a full version of the paper


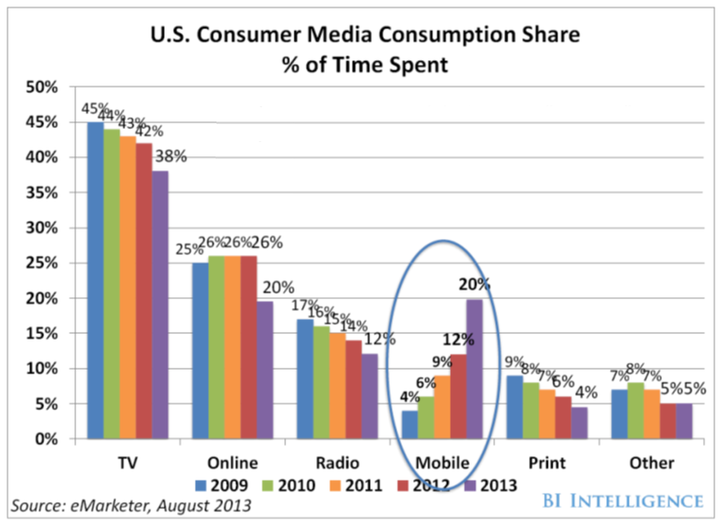
I’ve already said how technology (especially mobile phones) changes the process of making news for journalists, but it also changes ways of receiving information for the audience. According to the chart that was published by Business Intelligence in a recent study, we can see a huge increase in the category of people who consume media through a mobile phone. In this chart, we also can see stable popularity of audio-visual ways of consuming information, comparing to print and other (Chart 1).
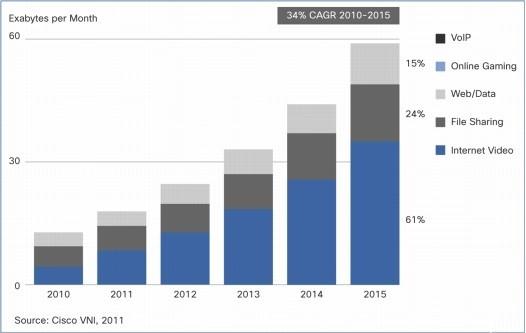
According to research and forecast chart, Cisco VNI has made, modern people spend their Internet traffic mostly on video content and this tendency will increase (Chart 2). Of course, analyzing such a chart, we should take into account that not only news in video format makes statistic data. People are watching films and self-made movies on YouTube. But still, it’s a proof of audience’s grooving interest to media information. And in the news-making process mass media counts on that too. Famous periodical editions now not only have their websites and digital analogs, but also translate more and more news information in the photo and video format, and Walter S. Mossberg’s example is a common one.
Another side of visualizing tendency is that the audience not only consumes more visual information but also creates one. Social networks already are used like platforms not only for delivering news but for searching for new information. “Today, Twitter is arguably the king of breaking news” (gettyimages.com). And as there’s no such authority for a common user’s post as for well-known journalist’s report in mass media, ordinary people widely use self-made photos and videos to confirm their information. NBC digital correspondent Mara Schiavocampo says that’s the way she often seeks news: what’s widely discussed by common people in social networks and can be proofed with photo and visual materials? (“The Future of News”)
As news media production becomes more visual and virtual, there’s a question about how one can be sold. It was easier to sell newspapers and have money from selling. But as TV practice prepayment so do most of the famous digital editions. Visiting their websites one can find out that hottest or more specific analytic information isn’t free, and subscription is advised. In the other case, news media content often is free for watching and money comes from advertising, depending on a number of viewers.
So now, based on tendencies I’ve researched I can try to make a forecast for news media production. Firstly, it’ll continue to become more visual with a view to (a) make it more convincing and (b) more personal. Also, visualization of information will increase depending on an audience willing to have a feeling they’re personally present on the event they’re informed about. So after visualization tendency, we will face a live broadcasting one. Media news information will be delivered mostly from the Internet, where all traditional mass media will be presented in their digital versions (websites) or just by having official accounts in social networks, where they’ll face a serious concretion from unprofessional, so-calls “citizen journalism”. Professional media production is going to win this battle exactly because it will stay professional: well-made because of well-paid, reliable and of good quality. So instead of reading “interesting people’s” blogs and following their accounts, most people will choose news media production from authoritative mass media sources. I suppose people will pre-order digital analogs just as our grandfathers pre-ordered newspapers, though new “number” will come strictly to our mobile phones through the apps wherever we are and will be formed exactly from news on subjects we wish to know